Uncategorized

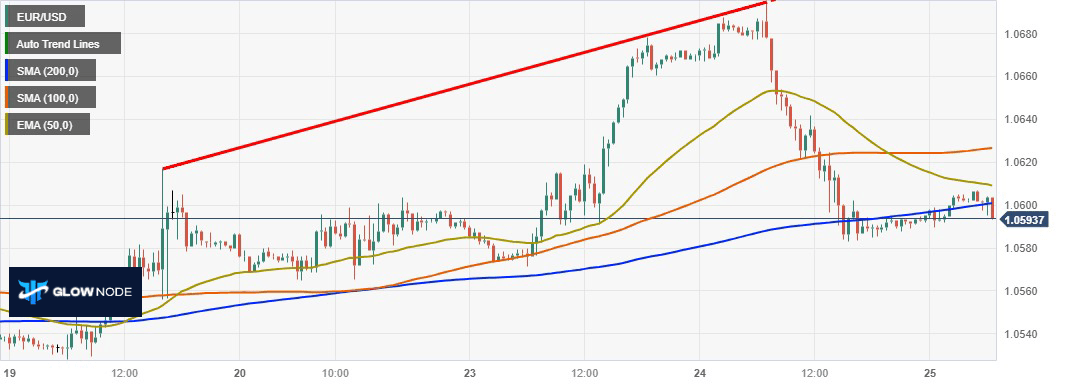
EUR/USD Technical Analysis: Bearish Pullback Threatens Euro’s Recent Rally

1. Price Movement: The EUR/USD pair experienced a sharp pullback from a fresh monthly high near 1.0700 on Tuesday. It dropped to the 1.0580 region and is currently slightly below the 55-day Simple Moving Average (SMA). This retracement erased the gains made on Monday. 2. Moving Averages: The pair has remained above the flat 20-day EUR/USD Technical Analysis: Bearish Pullback Threatens Euro’s Recent Rally

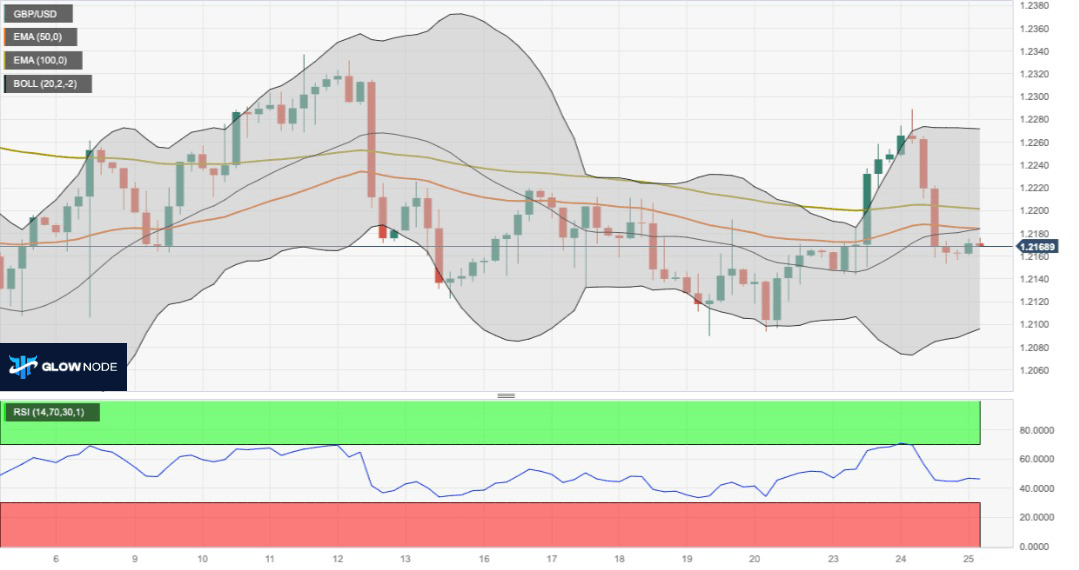
GBP/USD Analysis: Technical and Fundamental Overview Amid Geopolitical Tensions

Fundamental Analysis: 1. Market Behavior: The GBP/USD pair is currently trading below the 1.2200 level during the Asian session. This suggests a recent decline in the exchange rate. 2. Factors Impacting the Pair:    – US Dollar Decline: A decrease in the value of the US Dollar (USD) is providing some support to the GBP/USD GBP/USD Analysis: Technical and Fundamental Overview Amid Geopolitical Tensions

Gold Price Technical Analysis: Bullish Momentum Persists with Key Resistance at $1,980

Analysis Chart for Gold Price: – Buy-the-Dip Trade: The analysis chart for gold price indicates that the current strategy is to buy on dips, signifying that investors view temporary price declines as entry opportunities. – RSI Indicator: The 14-day Relative Strength Index (RSI) is depicted on the analysis chart, showing that it’s positioned just below Gold Price Technical Analysis: Bullish Momentum Persists with Key Resistance at $1,980

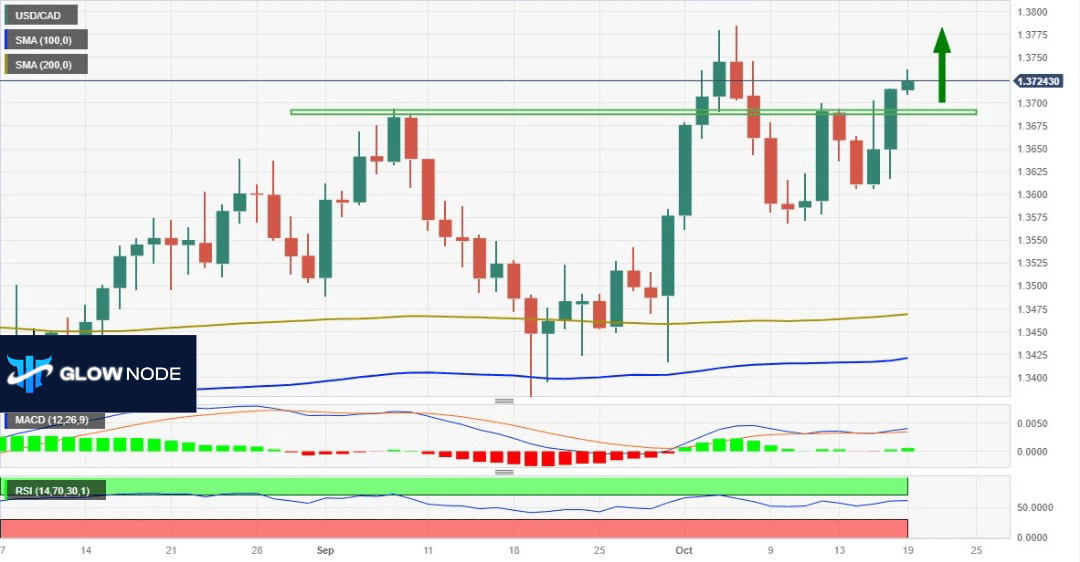
The USD/CAD seems ready to retest its monthly peak and is seeking a potential lift from Fed Chair Powell.

Technical Outlook Review From a technical standpoint, the recent sustained strength and the successful breach of the 1.3700 level are encouraging signs for bullish traders. Additionally, the oscillators on the daily chart have been showing positive momentum and are still some distance away from entering the overbought region. This suggests that the USD/CAD pair is The USD/CAD seems ready to retest its monthly peak and is seeking a potential lift from Fed Chair Powell.

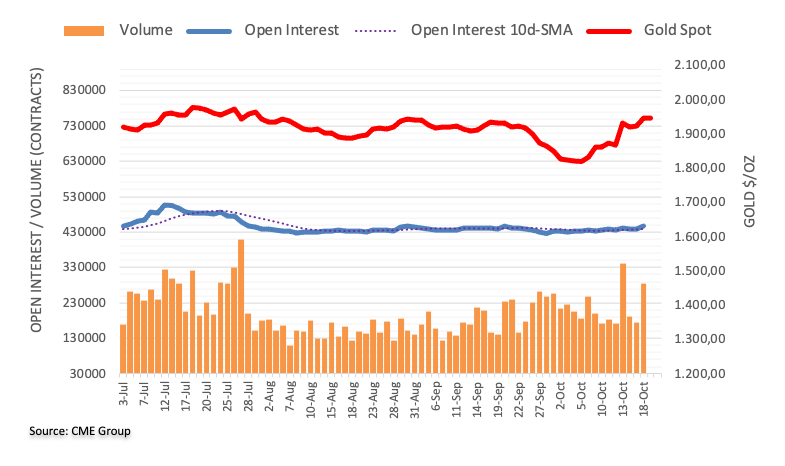
Opportunities for additional profits are available in Gold Futures.

Open interest in the gold futures markets rose for the second consecutive session on Wednesday, with preliminary data from CME Group indicating an increase of approximately 7.2K contracts. Additionally, trading volume also saw an uptick, climbing by around 110.6K contracts after two consecutive days of declines. Gold retargets the $1980 region On Wednesday, gold prices Opportunities for additional profits are available in Gold Futures.

Gold Price Prediction: XAU/USD is looking for confirmation above the $1,950 mark as it continues its upward trend. (DAILY CHART)

The price of Gold reached a new four-week high of $1,943 early on Wednesday before experiencing a period of consolidation with upward momentum. Despite a slight pullback, the Gold price remains robustly above the crucial 20-Daily Moving Average (DMA) at $1,930, a level it convincingly breached earlier. The 14-day Relative Strength Index (RSI) indicator is Gold Price Prediction: XAU/USD is looking for confirmation above the $1,950 mark as it continues its upward trend. (DAILY CHART)

EUR/USD Market Update: Mixed Signals and Technical Analysis for Potential Direction

Here’s a breakdown of the key points: Market Summary: Technical Analysis: The technical analysis outlines potential support and resistance levels, suggesting a range of possible future scenarios for the currency pair. However, the direction of the EUR/USD will also depend on broader economic and geopolitical developments.

Gold Price Technical Analysis: Safe Haven Appeal Amidst Gaza-Israel Conflict

Bearish Scenario: Bullish Scenario: This analysis provides both bearish and bullish scenarios for Gold prices, along with support and resistance levels. The mention of the death cross serves as a cautionary signal for bullish traders. This analysis can be valuable for traders and investors looking to make informed decisions in the Gold market, but it’s Gold Price Technical Analysis: Safe Haven Appeal Amidst Gaza-Israel Conflict

Gold Price Technical Analysis: RSI Caution, Bull Cross, and Key Levels to Watch

Here’s an analysis of the Gold price on the four-hour chart: 1. Stalled Recovery with Overbought RSI:    – The Gold price has experienced a stall in its recovery momentum.    – The Relative Strength Index (RSI) indicator is in the overbought region. An overbought RSI suggests that the asset may be due for a Gold Price Technical Analysis: RSI Caution, Bull Cross, and Key Levels to Watch

Gold Price Technical Analysis: Potential Scenarios and Caution Signals

The provided passage appears to be a technical analysis of the Gold price. Technical analysis is a method used in finance to forecast future price movements of an asset by analyzing historical price and volume data, as well as various technical indicators. Here’s a breakdown of the key points made in this analysis: This technical Gold Price Technical Analysis: Potential Scenarios and Caution Signals