TABLE OF CONTENTS
The USDCAD seems ready to retest its monthly peak and is seeking a potential lift from Fed Chair Powell.
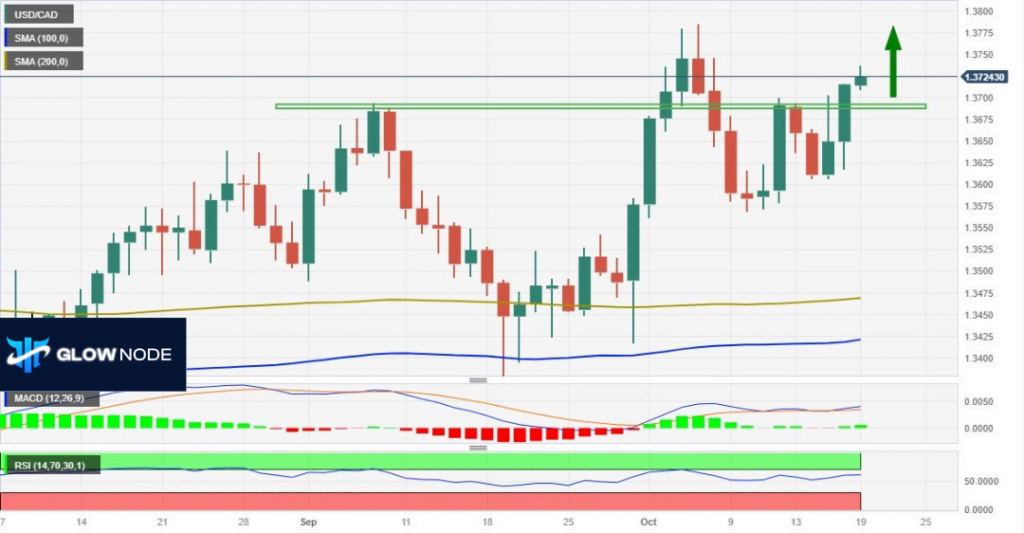
USDCAD prepares to retest its monthly peak, buoyed by sustained strength and breach of the 1.3700 level, favoring bullish traders. Positive momentum on daily chart oscillators indicates further upward trajectory, potentially challenging multi-month high at 1.3785 and year-to-date peak near 1.3860. Support at 1.3700 guards against immediate downside, with additional support at 1.3655-1.3650 and 1.3600. A breach of 1.3575 SMA on 4-hour chart may favor bearish sentiment. Traders advised to monitor support levels for potential reversals or shifts in market sentiment.
Blog written by: Glow Node

technical analysis
From a technical standpoint, the recent sustained strength and the successful breach of the 1.3700 level are encouraging signs for bullish traders.
Additionally, the oscillators on the daily chart have been showing positive momentum and are still some distance away from entering the overbought region.
This suggests that the USD/CAD pair is more inclined towards an upward trajectory. Consequently, it appears likely that the pair may make a move towards retesting the multi-month high, which was reached at around 1.3785 last Wednesday.
There’s potential for further gains beyond the 1.3800 round-figure mark, which could open the door to a challenge of the year-to-date peak, approximately at the 1.3860 level, as witnessed on March 10.
On the flip side, the 1.3700 round figure now acts as a support level, guarding against immediate downside risks. In the event of further decline, it’s probable that new buying interest will emerge in the vicinity of the 1.3655-1.3650 range.
This support should help limit losses, particularly around the key 1.3600 mark, marked by the 100-day Simple Moving Average (SMA). Beyond this, traders should watch out for the 200-period SMA on the 4-hour chart, currently located around the 1.3575 area.
A decisive breach of this level could shift the market sentiment in favor of bearish traders. Under such circumstances, spot prices might become vulnerable to a more significant decline, possibly targeting the 1.3500 psychological level.
This analysis suggests that bullish momentum remains strong, but key support levels have been identified to monitor potential reversals or bearish shifts. Keep a close eye on price action and these levels for informed trading decisions.