GBPUSD Analysis: Technical and Fundamental Overview Amid Geopolitical Tensions
This analysis of the GBP/USD pair offers a comprehensive examination, blending fundamental and technical perspectives. Fundamental factors, including market behavior and geopolitical tensions, are discussed alongside technical indicators such as moving averages and key resistance/support levels. Traders are advised to carefully consider these insights, alongside additional research, when making trading decisions.
Blog written by: Glow Node

fundamental analysis
1. Market Behavior: The GBP/USD pair is currently trading below the 1.2200 level during the Asian session. This suggests a recent decline in the exchange rate.
2. Factors Impacting the Pair:
– US Dollar Decline: A decrease in the value of the US Dollar (USD) is providing some support to the GBP/USD pair.
– Retreat in US Treasury Yields: A drop in US Treasury bond yields is also contributing to the pair’s support.
– Geopolitical Conflicts: Safe-haven flows are being observed due to geopolitical conflicts in the Middle East, which may cap the downside of the USD.
– Higher-For-Longer Rates in the US: The expectation of higher interest rates in the US is another factor that could limit the decline in the USD.
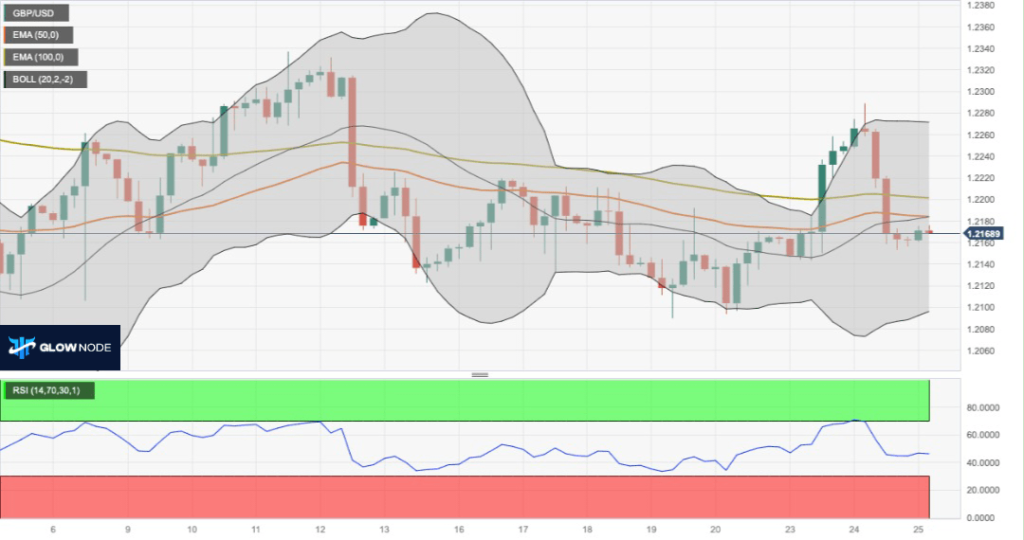
3. Current Price: The pair is trading at 1.2170 at the time of the analysis.

technical analysis
1. Moving Averages: On the four-hour chart, GBP/USD is currently trading below the 50- and 100-hour Exponential Moving Averages (EMAs), which suggests a favorable environment for further downward movement.
2. Relative Strength Index (RSI): The RSI is below 50, indicating bearish momentum and supporting sellers in the near term.
3. Key Levels:
– Key Resistance at 1.2200: This level is significant and acts as a confluence point for the 50-hour EMA and a psychological round figure. Breaking above 1.2200 could lead to further gains, with potential targets at 1.2218, 1.2271 (the upper boundary of the Bollinger Band), and 1.2295 (a high from October 10).
– Key Support Levels: Initial support is at 1.2143 (low of October 23), followed by 1.2122 (low of October 13). The critical support zone is in the 1.2095–1.2100 range, which includes a psychological round mark, the lower limit of the Bollinger Band, and a low from October 20. If this level is breached, the pair may continue to drop, with the next potential target at 1.2052 (low of October 3).
In summary, the chart analysis combines both fundamental and technical factors to provide insight into the current state of the GBP/USD pair. It highlights key support and resistance levels, along with potential price targets based on technical indicators and recent market developments. Traders should consider this information as part of their decision-making process and conduct further research and analysis before making trading decisions.